

 Reimagined
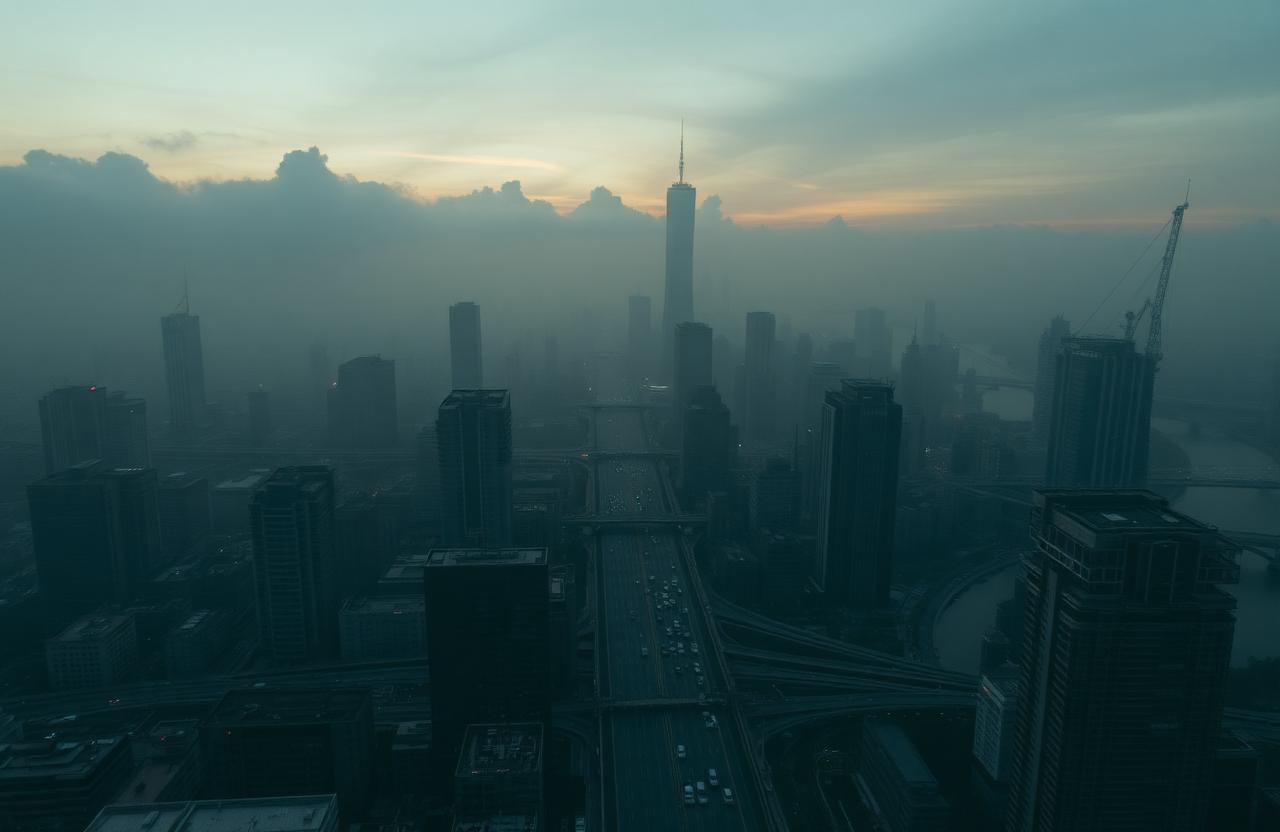 Today
TodayEast Asia
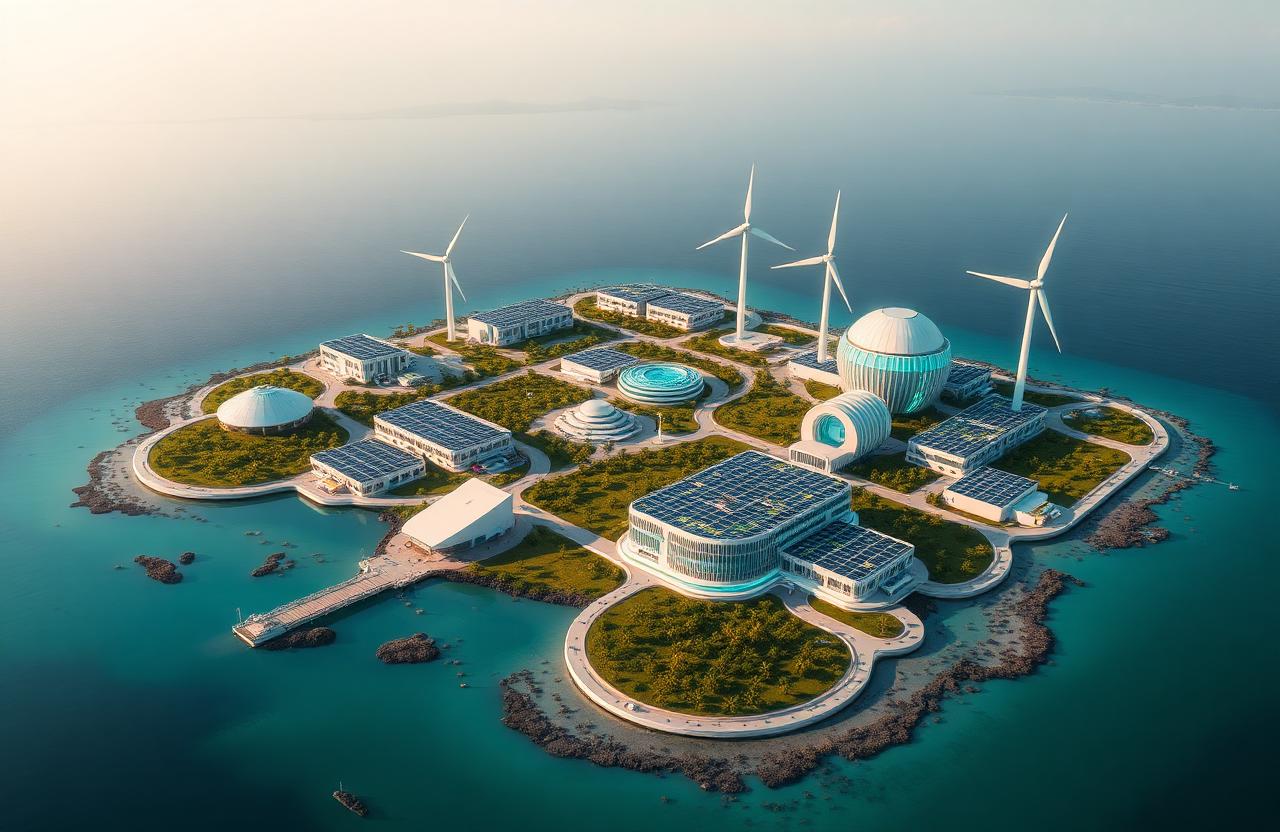
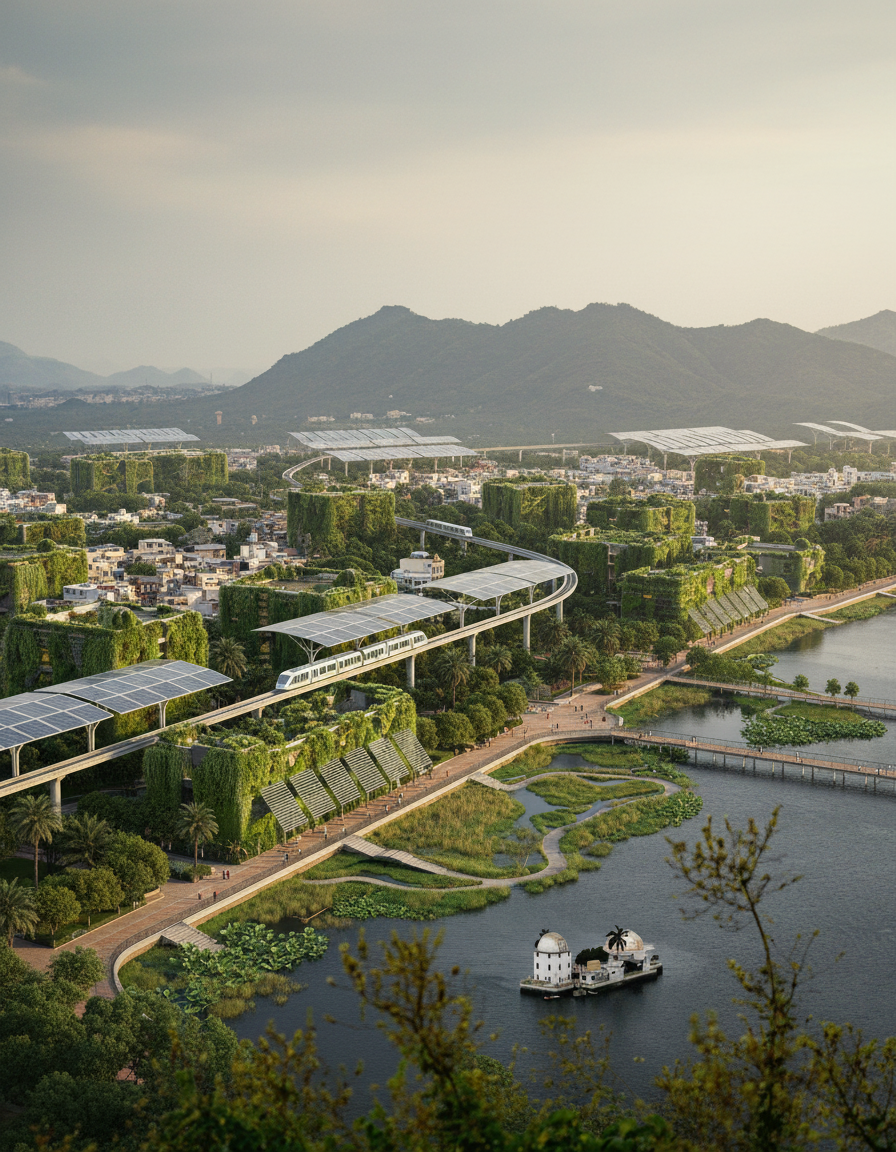
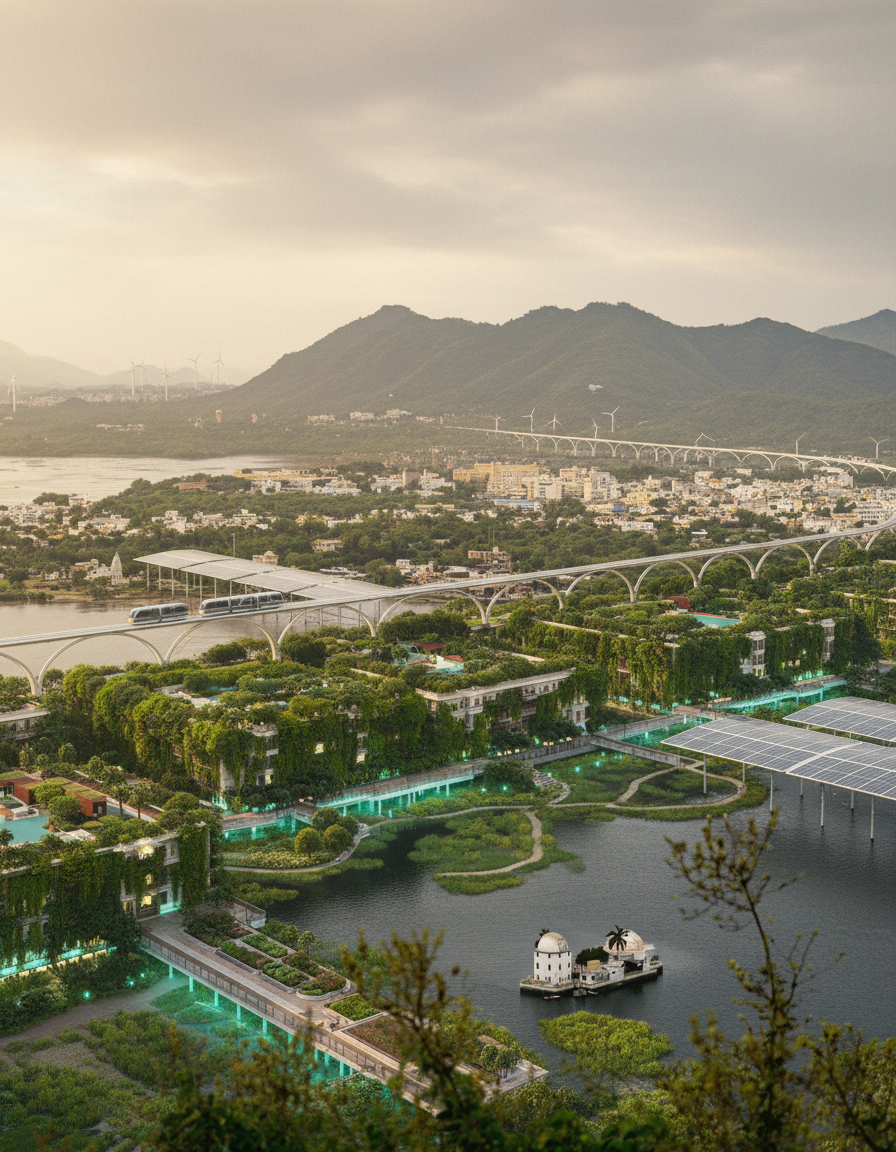
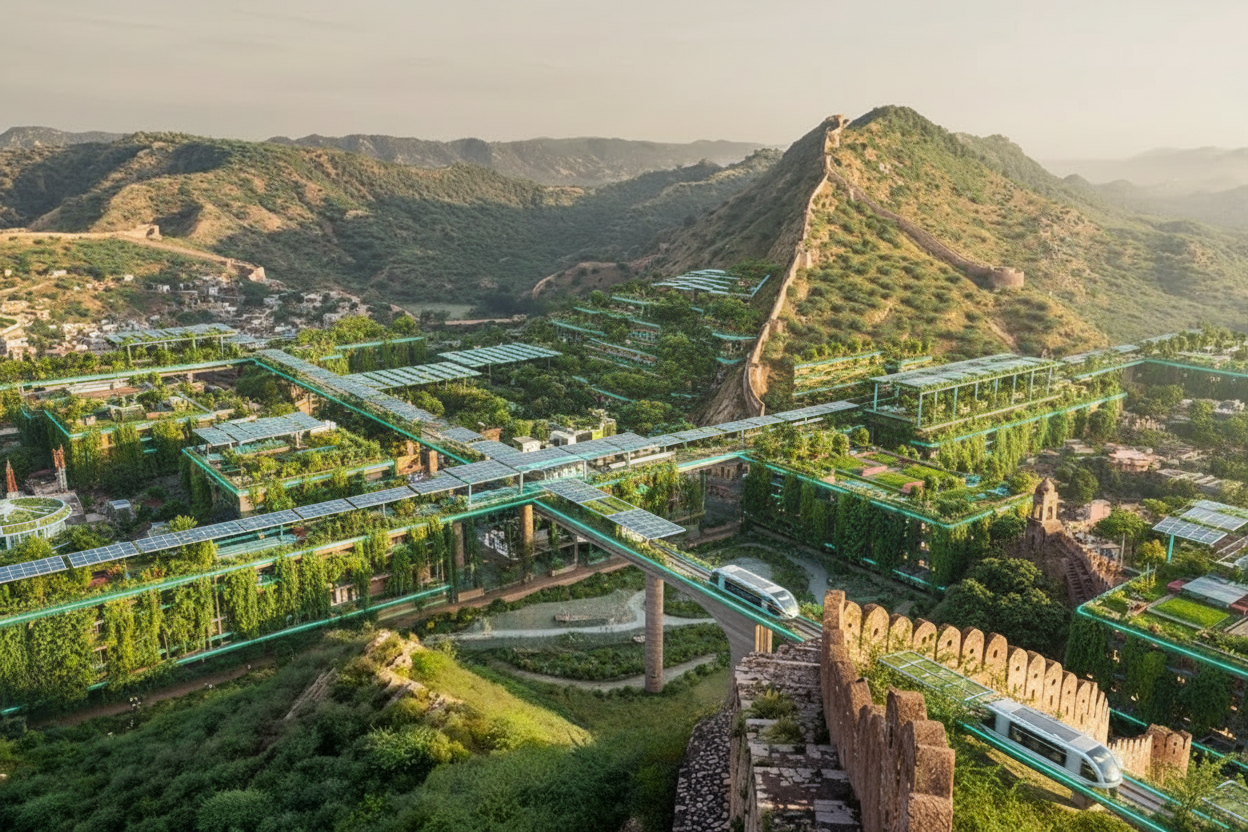
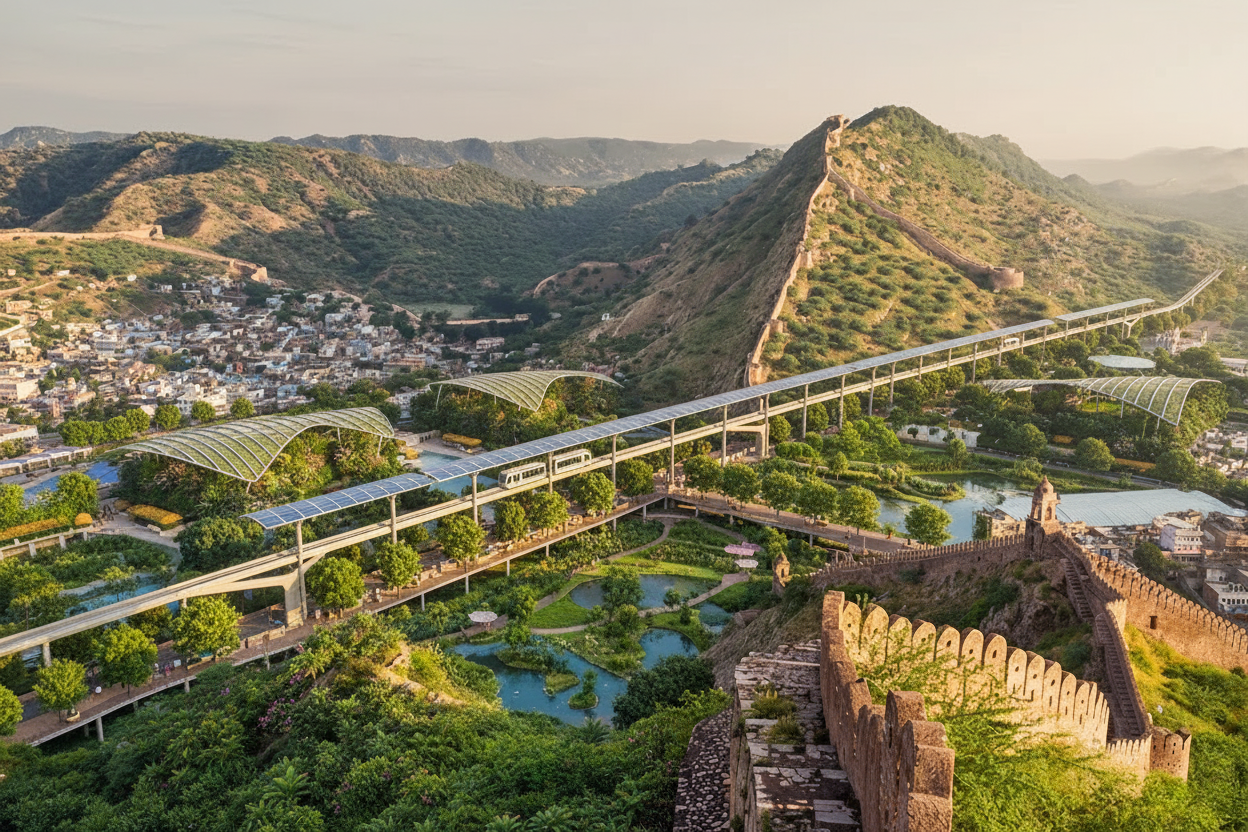
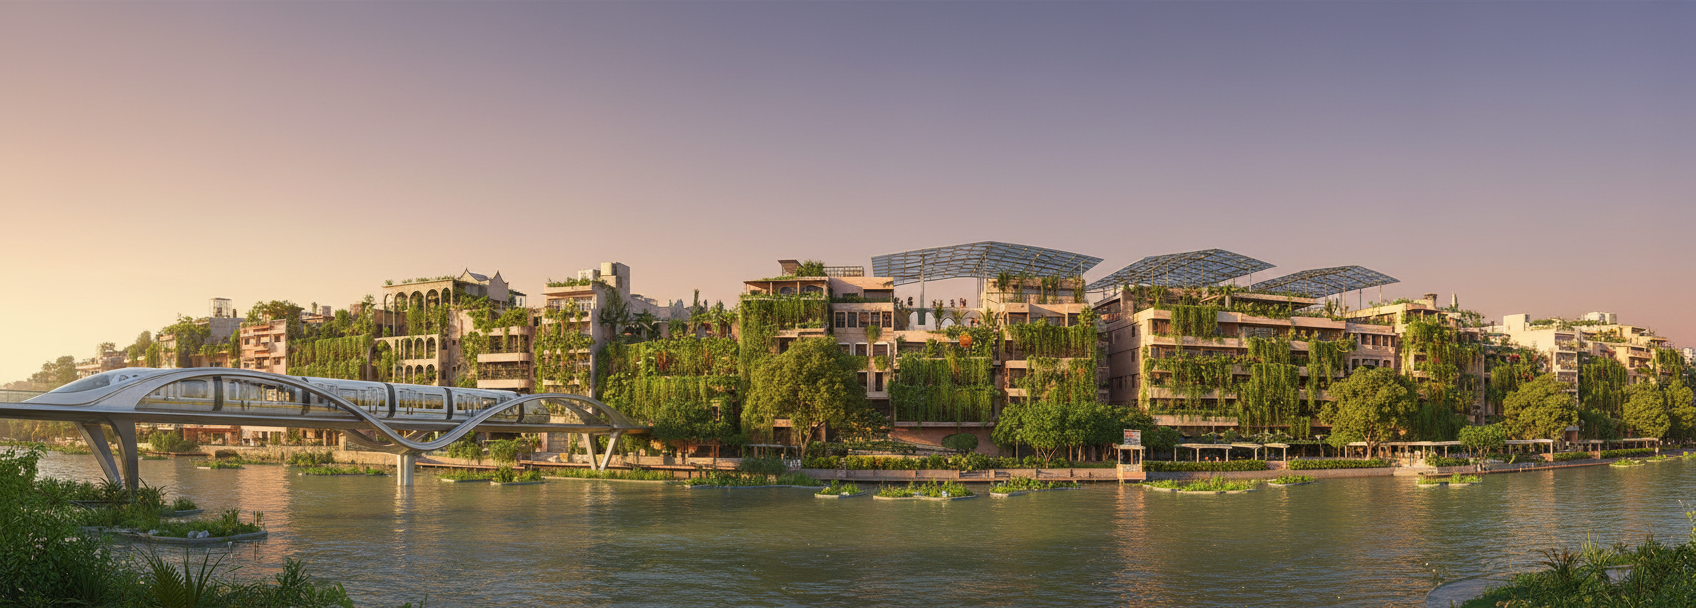
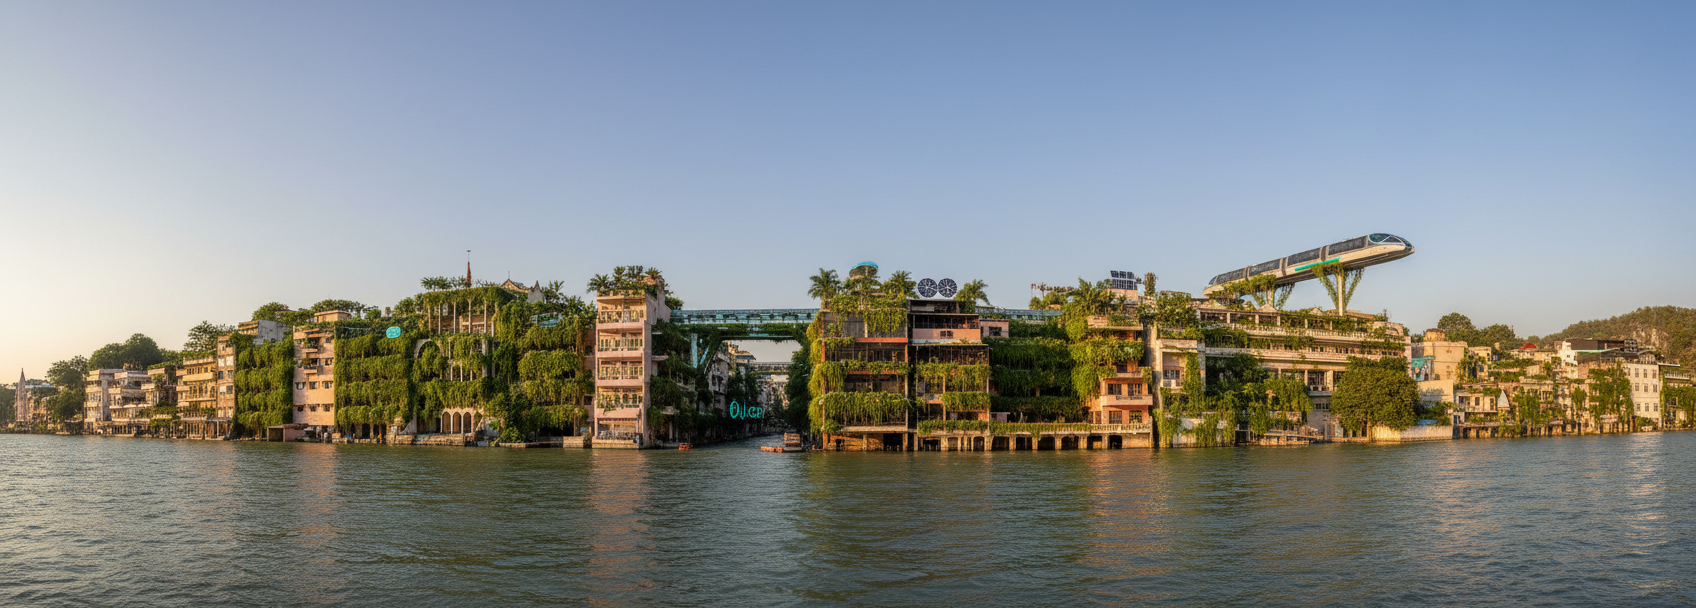
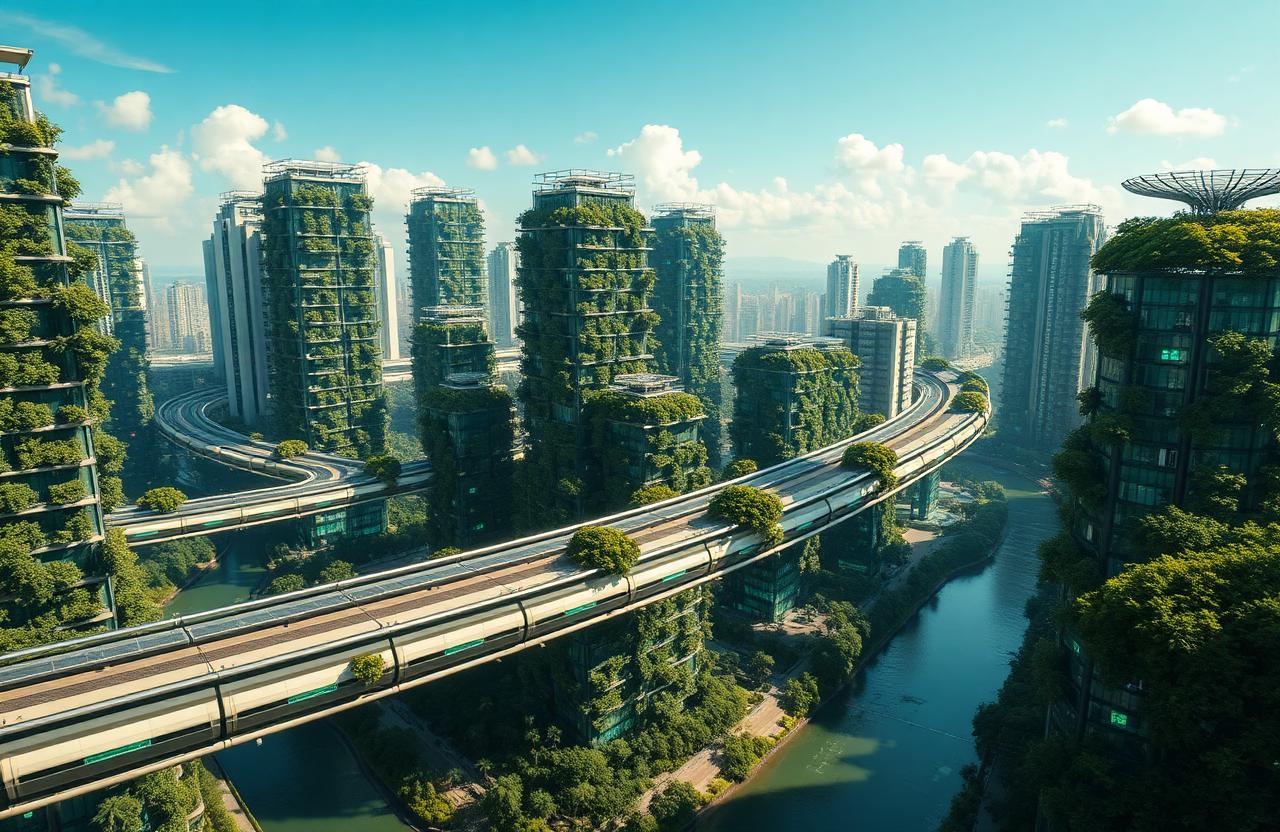
Neo Shanghai
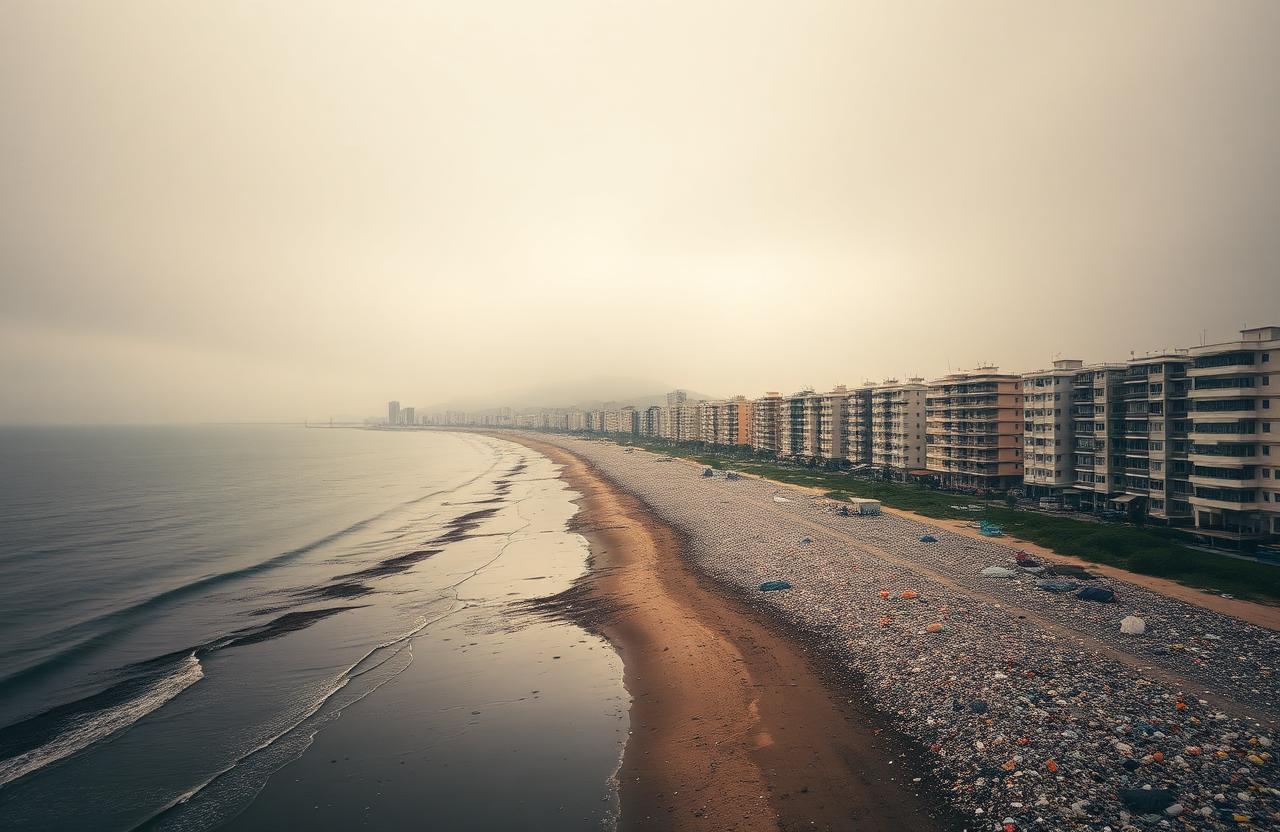
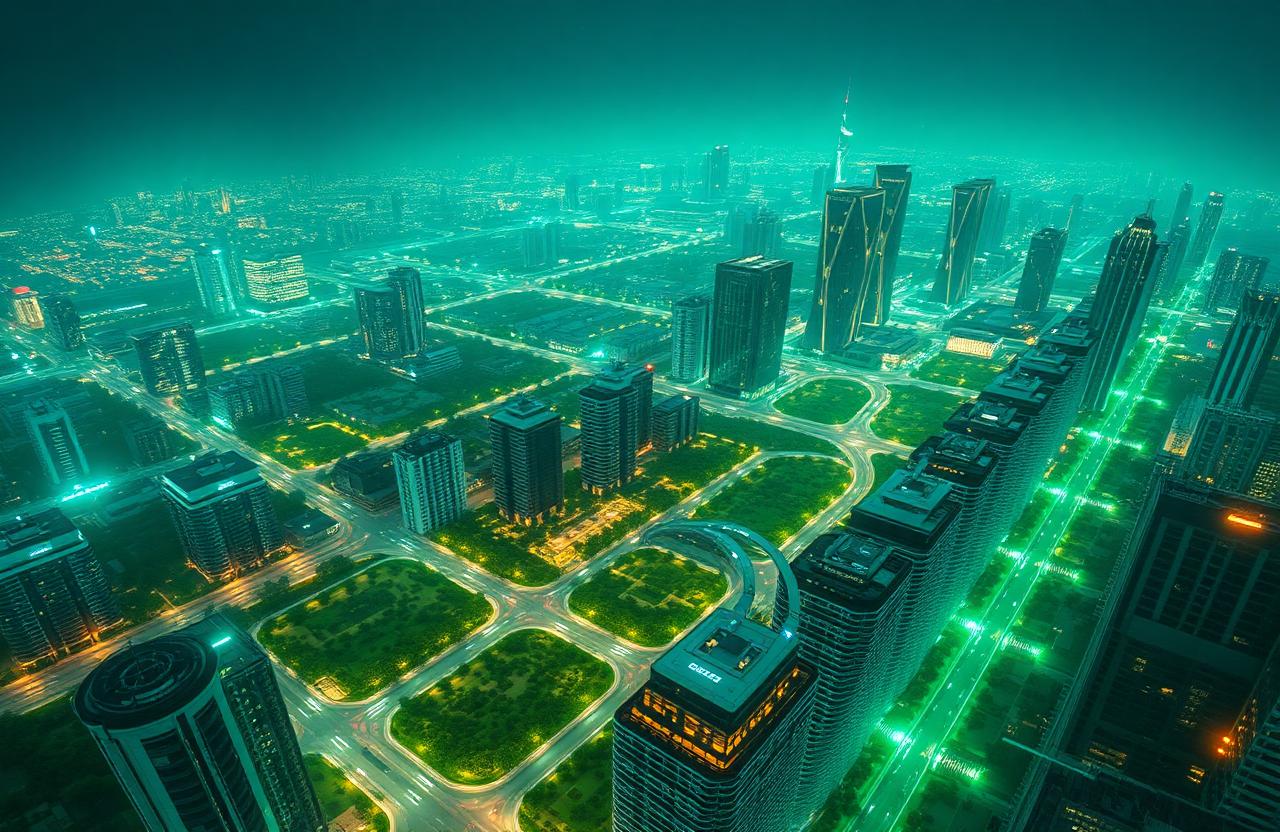
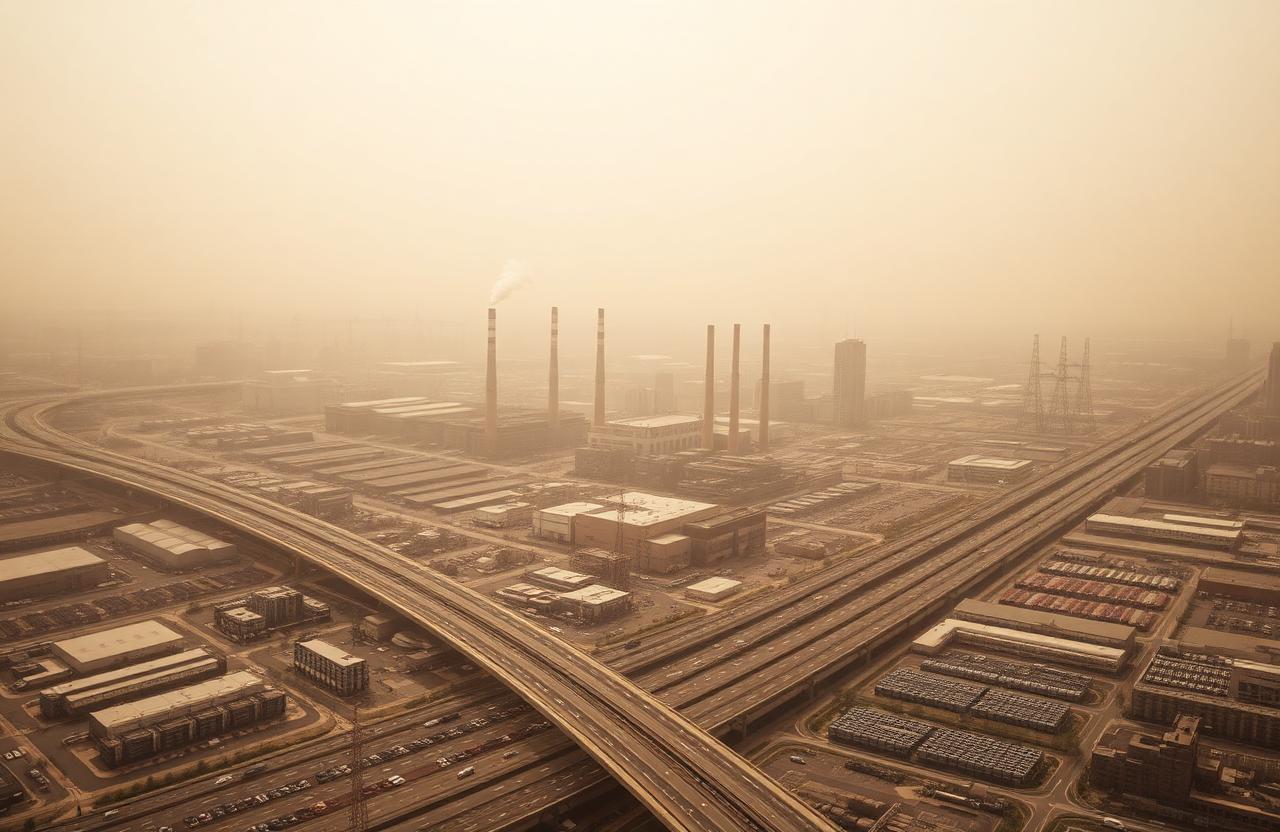
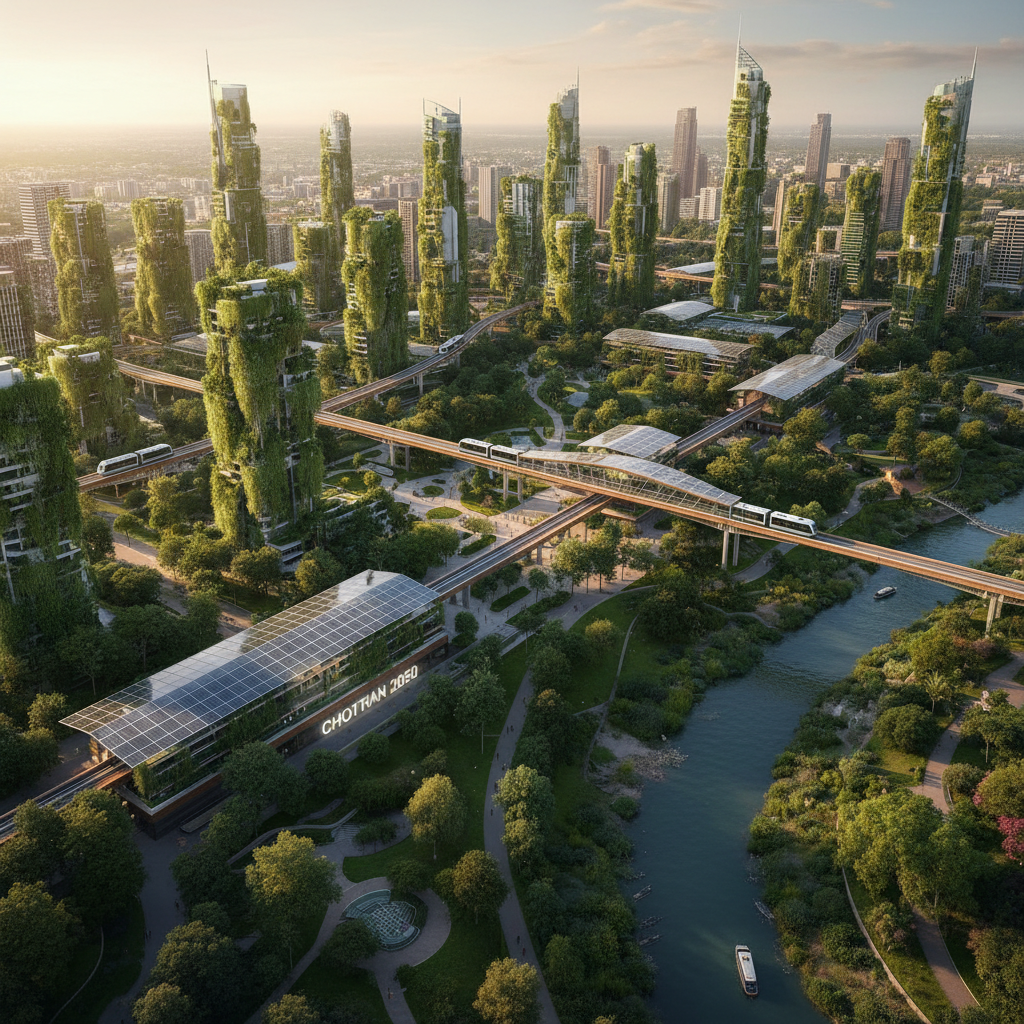
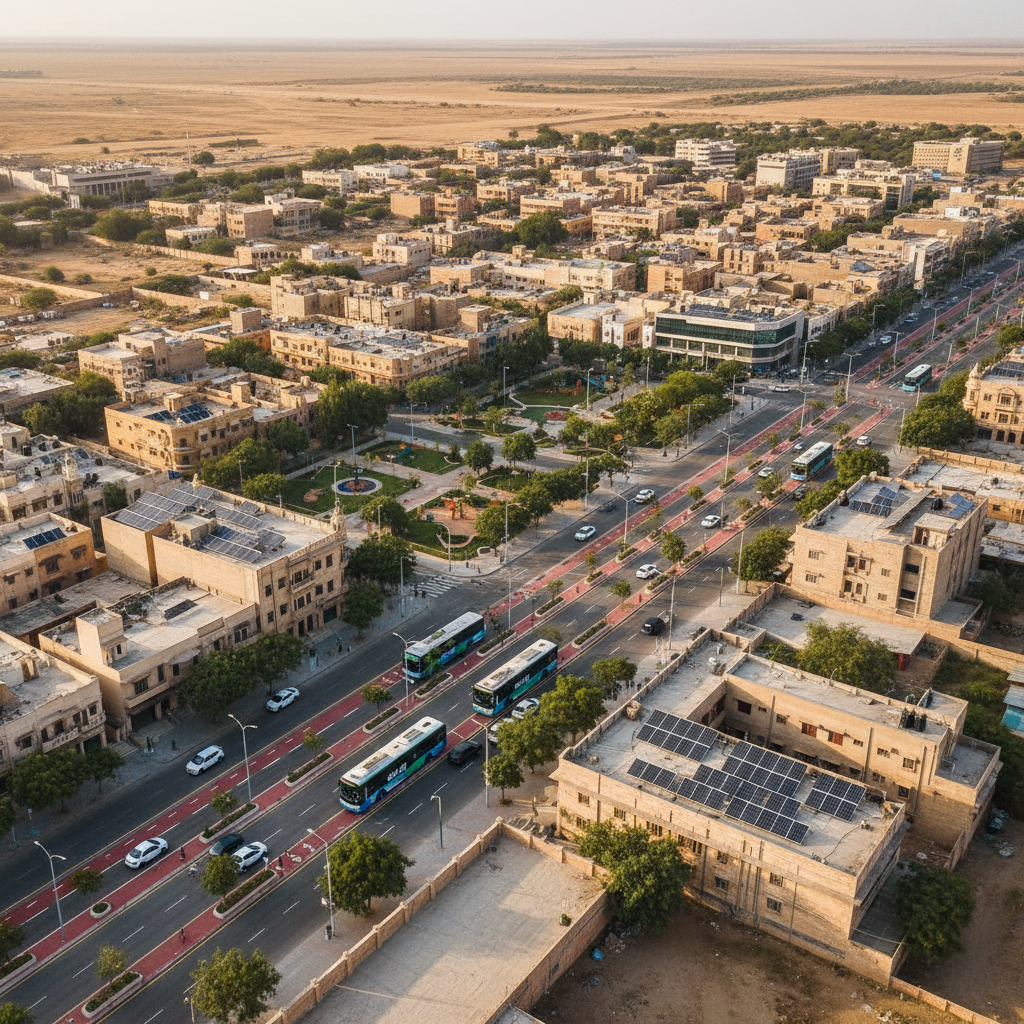
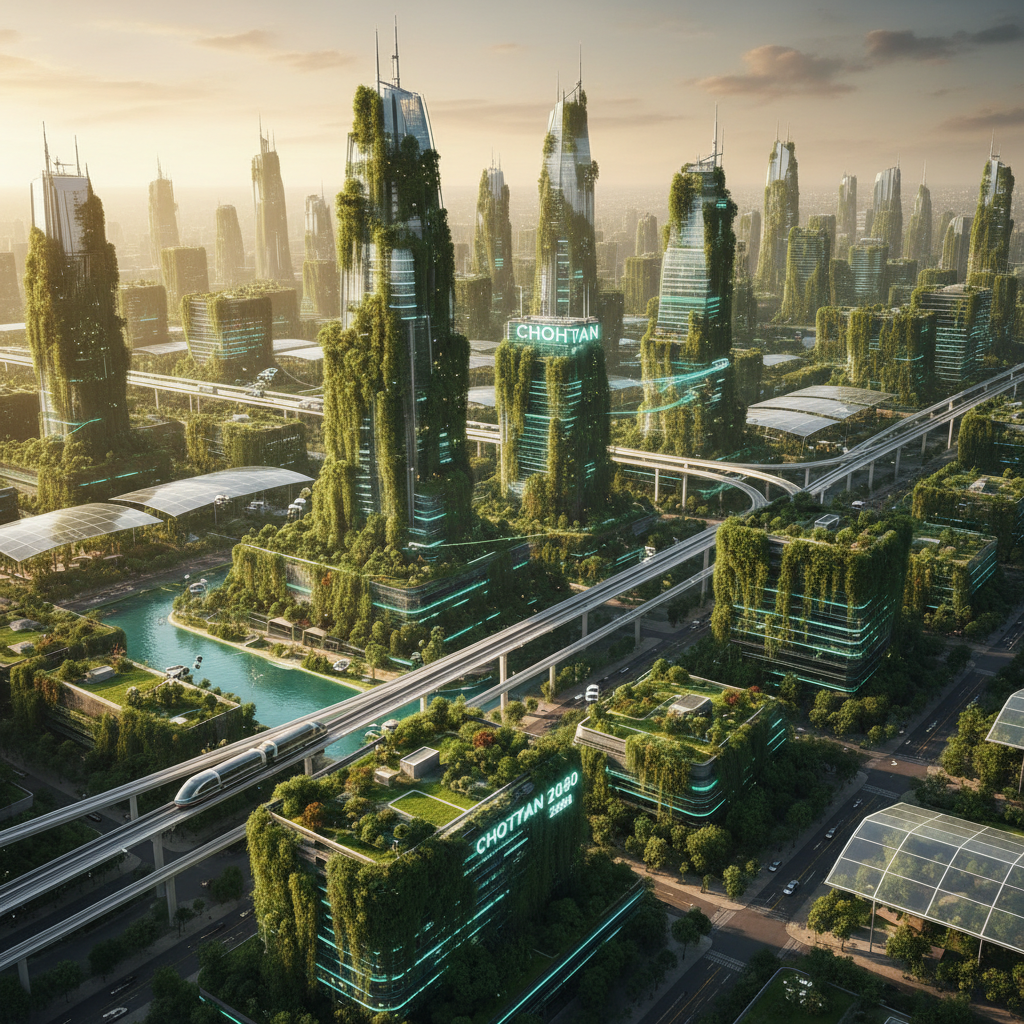
From smog-choked grid to vertical forest metropolis
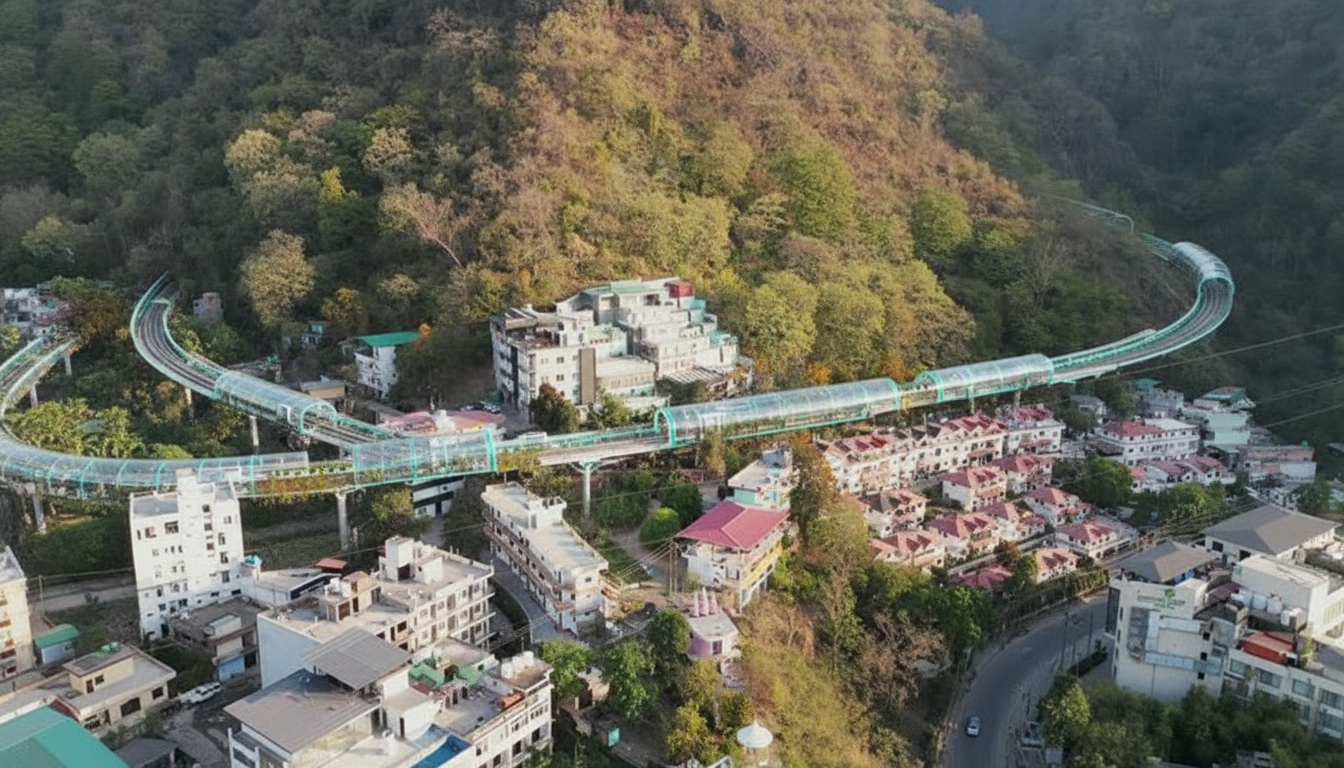
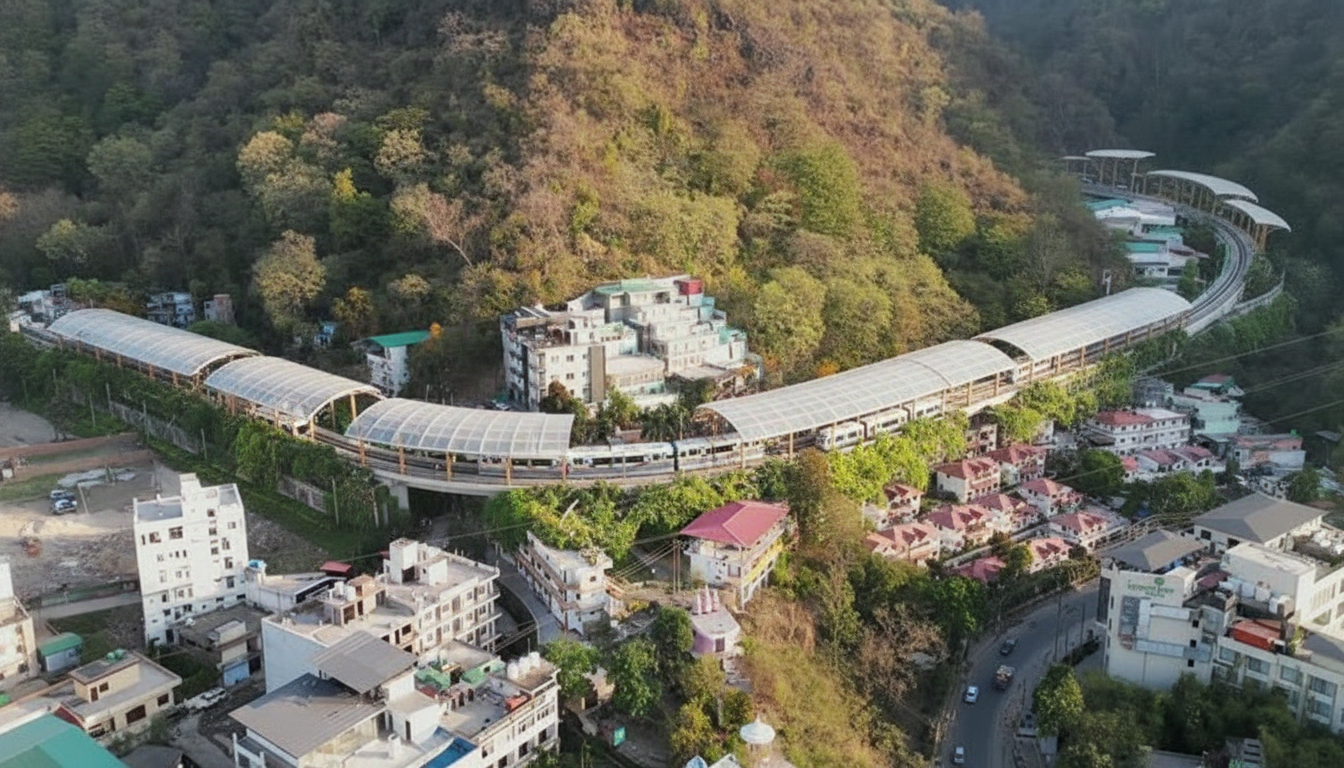
Replacing eight-lane gridlock with elevated maglev corridors and biophilic towers that scrub 14 tons of CO₂ per day.
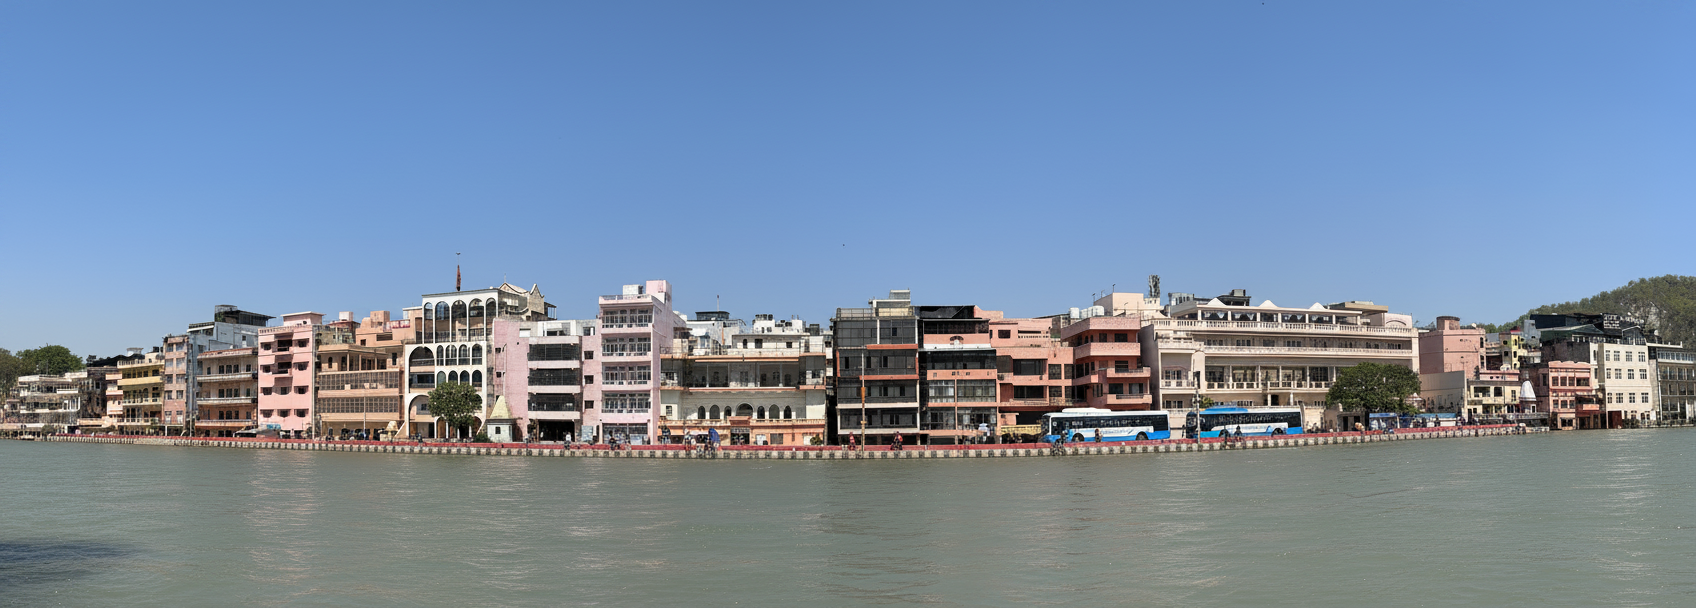
Air quality
AQI 198 — hazardous → AQI 32 — pristine
Avg commute
72 min by car → 11 min by maglev
Green cover
6% → 47% (vertical + parks)